Blog /
Industry Insights
C&I Battery Developer’s guide to the 2022 NEM
February 7, 2023

The electricity market in the calendar year 2022 was one for the history books. The average energy price across the NEM jumped above $190, 2.5x that of 2021 and double as high as the previous highest average price in 2017.
The impact of global gas market prices spiking due to the war in Ukraine and the unscheduled outages of Australia’s aging coal plant led to the National Electricity Market going haywire. Following a period of sustained high prices in June, the Cumulative Price Threshold was reached, and administered price caps were enforced, creating a ceiling price for the market. Squeezed between rising input costs and the ceiling price, generators started to withdraw from the market. Ultimately AEMO resorted to the extraordinary measure of suspending the market between 15 June and 24 June, and everyone in the energy industry was collectively left asking: “What the hell happens now?”
The extraordinary goings-on in the market is best represented by the chart below. In 2022, the number of “critical peak price” events - those exceeding $300 per MWh - jumped from the typical less than 1% to between 8 - 16%.
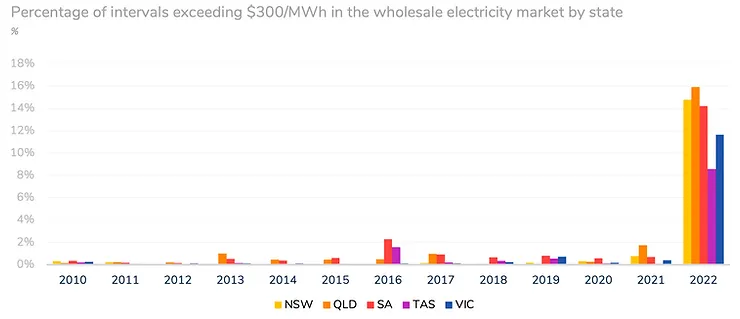
Figure 1: Percentage of intervals greater than $300/MWh in the wholesale electricity market by state by year (AEMO data, Orkestra analysis)
But what does this all mean for batteries, now and going forward? In this, we provide an overview of the market in 2022, how it compares to previous years, and what future trends we are starting to see.
NOTE: This blog has been prepared using data and analysis that exists as a standard feature of Orkestra’s software in our data library. See screenshots from our software below.


Figure 2: Screenshots of Orkestra's Wholesale and FCAS library price data viewers. (Click to view full screen)
The Wholesale Electricity Market
If we plot average wholesale market prices by state, we see a number of interesting trends occurring in 2022. There was of course a significant jump in both average and critical peak prices, but we are starting to see a separation of prices between northern (QLD and NSW) and southern (VIC and TAS) states. This is largely driven by the increasing penetration of solar in the northern states and the saturation of interconnectors, contributing to the separation of prices.
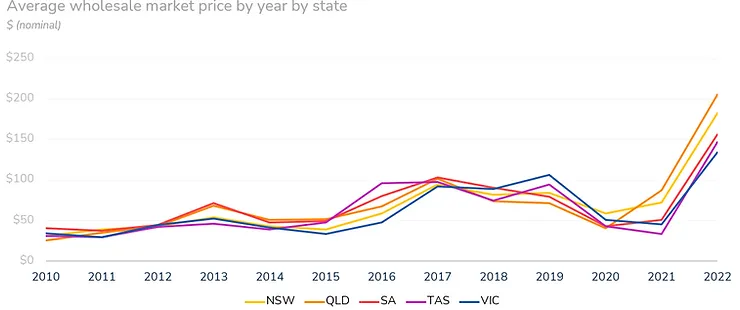
Figure 3: Average wholesale electricity market by state by year (AEMO data, Orkestra analysis)
If we zoom in on daytime and evening average prices, we see that much of the price rise was driven by evening price rises. Notability QLD’s evening average price jumped to an eye-watering $395/MWh over the entire year!
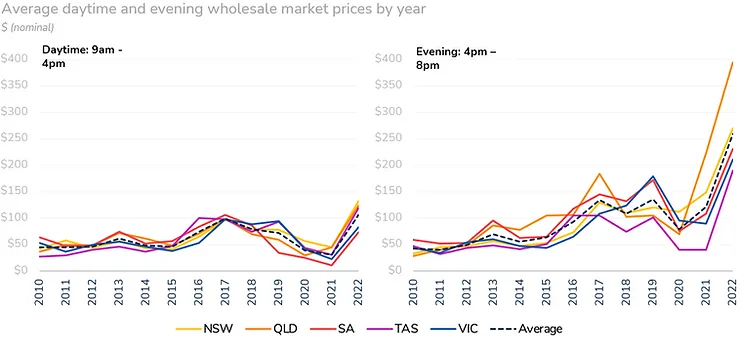
Figure 4: Average daytime (9am - 4pm) and evening (4pm - 8pm) wholesale electricity market by state by year (AEMO data, Orkestra analysis)
What we are witnessing is an increased spread between daytime and evening prices. As the sun dips below the horizon, gas is (partly) required to meet the evening demand. Gas peak power plants were commonly setting the price during these periods, so with gas prices at an all time high, the marginal electricity price was also at an all time high. The average spread between daytime and evening prices jumped from $91 in 2021 to around $150 in 2022. We expect this to temporarily dip back down in the near future as gas markets steady, but the chart below shows that the spread of prices from daytime to evening has been steadily widening for around a decade. This will likely only increase as solar uptake increases.
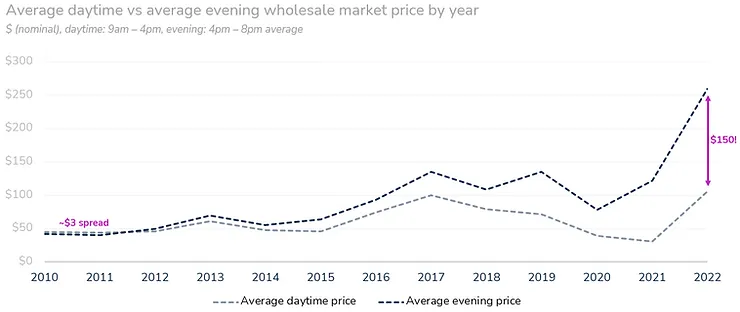
Figure 5: Average wholesale electricity market by year (AEMO data, Orkestra analysis)
We can see the effect of solar more acutely if we look at the daily wholesale price charts for NSW over the last 4 years. Here we see the electricity market volatility increasing, even before the outlier events of 2022. We also see the average price curve taking on a familiar duck curve shape caused by increasing solar penetration.
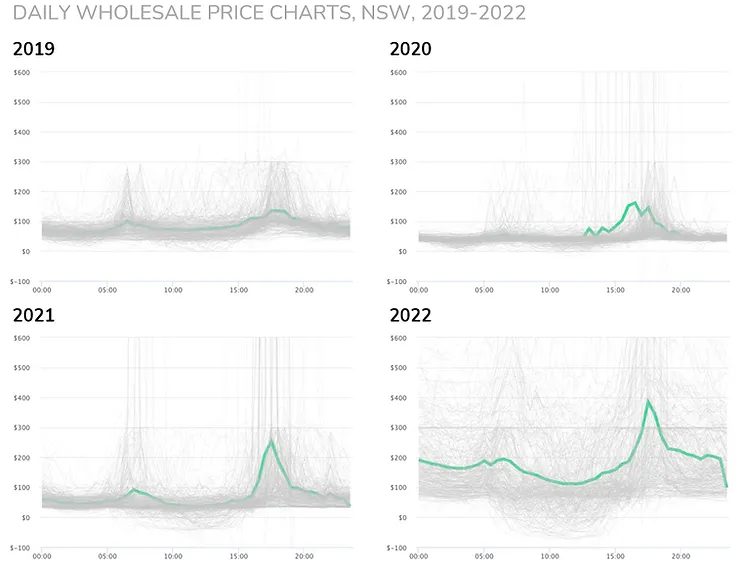
Figure 6: Daily wholesale price curves. Every grey line represents the price curve for a given day of the year. The green curve represents the average daily price. (Source: AEMO data, Orkestra software)
These price curves reflect the extraordinary reduction in generation output of black coal power stations, being replaced by zero marginal cost rooftop and utility solar.

Figure 7: Average NSW black coal-fired generation output time of day (Source: AEMO Quarterly Energy Dynamics Q4 2022)
The contingency FCAS markets
While the wholesale energy market was reaching historical highs, some of the heat started to come out of the contingency FCAS markets in 2022 compared to both 2021 and 2020. While still high compared to pre-2016 levels, the average contingency FCAS price for 2022 fell for all states except SA and TAS. To some degree, this is because of substantial falls from historic price highs in QLD in 2021 and SA in 2020, which both experienced extended islanding events that led to contingency FCAS needing to be sourced only from within their local market region.
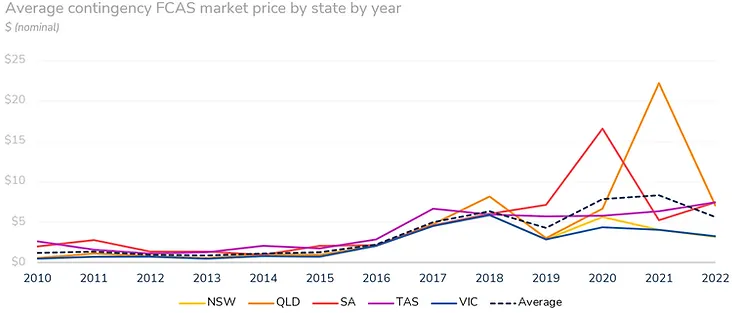
Figure 8: Average contingency FCAS market price (all markets) by state by year. (Source: AEMO Data, Orkestra Analysis)
We see 2022’s slight price downturn also reflected in the total FCAS market turnover. The value of FCAS markets is dominated by times when there is a shortage of supply in particular jurisdictions. For example, most of the value in the FCAS markets in 2021 was a consequence of the Queensland-New South Wales Interconnector (QNI) upgrade where QLD FCAS supply needed to be locally, rather than nationally sourced. (That is, lower supply with consistent demand = higher prices).
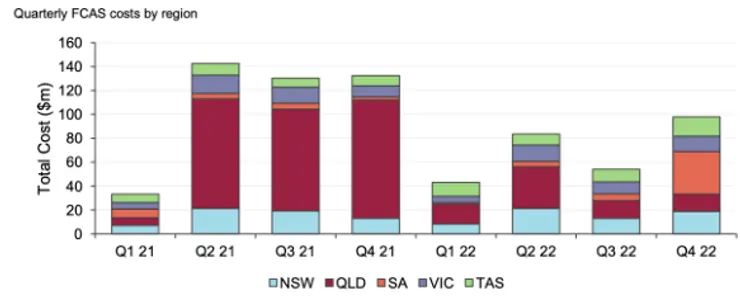
Figure 9: Quarterly FCAS costs by region (Source: AEMO Quarterly Energy Dynamics Q4 2022)
Drilling down on the individual markets, we saw fairly universal falls across the Contingency Raise markets. Tasmania is an outlier, with Raise 6 second prices increasing with very little reserve available in the state to support contingency events.
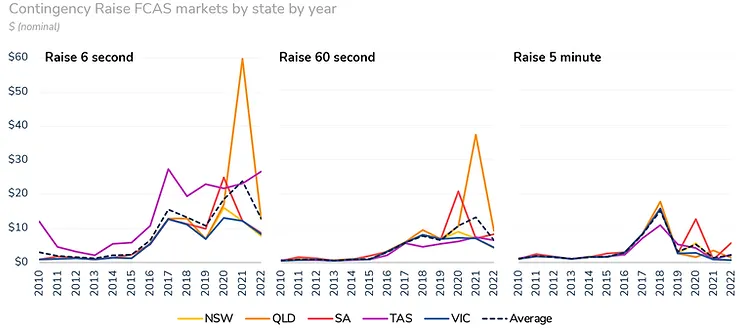
Figure 10: Average price for Contingency Raise FCAS markets by state by year (Source: AEMO data, Orkestra Analysis)
The contingency Lower markets, while comparatively substantially less valuable (note the 3x change in the y-axis), were less bearish, with many Lower market services increasing in value. One probable driver of the increase in Lower market value is that many coal generation units that previously provided the Lower FCAS service around the clock, are now dropping out of the FCAS market supply stack during solar hours. Due to solar driving increasingly low, often negative energy prices during solar hours, coal generators are ramping down to their lowest possible stable output levels to minimise their losses from negative prices. Because these coal units are already at their minimum possible output, they can not ramp down further, and therefore cannot provide Lower FCAS services. If they could, coal units would simply shut down in the middle of high-solar days, to avoid negative prices entirely - but coal units aren’t flexible enough to do this. Because they typically take several hours to return to service after a shutdown, the operators choose to leave the units running, wearing losses during solar hours, with the hope they’ll make them up after the sun sets.
The Lower 60 markets in NSW, VIC and TAS have all seen market prices go from 10 to 15 cents prior to 2019 up to $3.50 - $4 in 2022. This follows a similar, but earlier trend in QLD and SA.

Figure 11: Average price for Contingency Lower FCAS markets by state by year (Source: AEMO data, Orkestra Analysis)
This effect is very clear when you look at the average Lower 60-second market average price over the last few years forming a near-perfect average solar generation curve. We also see the jump in energy prices in the evening peak flowing through to high prices to deliver Contingency Raise FCAS in the evening.

Figure 12: Daily Average FCAS Prices in NSW, by market, by year (Source: AEMO data, Orkestra Analysis)
Looking at market participation, batteries have continued their steady (and likely inexorable) takeover of the FCAS markets and as of last quarter, represented two-fifths of the market share. With the very large numbers of batteries under construction or proposed, we expect this share to only increase with time and for the FCAS market to be eventually saturated with supply.
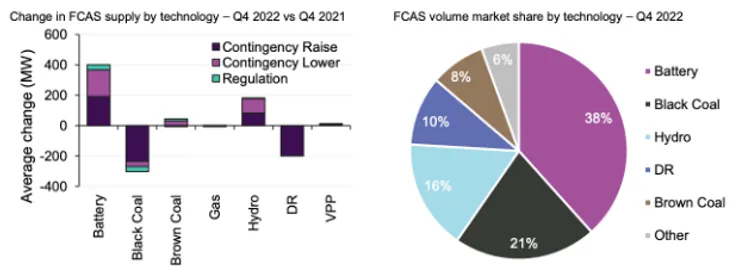
Figure 13: Charge in FCAS supply and FCAS volume market share by technology(Source: AEMO Quarterly Energy Dynamics Q4 2022)
What does this mean for battery projects going forward?
- Firstly, short of another major global conflict, we are unlikely to see a repeat of market events in 2022. We recommend battery proponents consider 2022 as a “high case” revenue year. For more representative historical years, we recommend 2021 wholesale market prices to be more indicative of the near-term electricity market. (That is, a strong spread of daytime and evening prices, and more typical levels of wholesale price intervals above $300/MWh.)
- That said, we expect all the trends driven by increasing renewable energy in 2022 to only accelerate in this decade as Australia seeks to jump from 35% renewable energy in 2022 to 82% by 2030. Specifically:
- Daily spreads and incidence of critical peak prices (>$300/MWh) to stay relatively high unless the National Cabinet successfully implements some type of capacity market and price volatility settles to similar levels, to say the SWIS. (This itself will likely be an opportunity for batteries. More on this in a future blog.)
- The spread of daytime and evening prices is likely to further increase as solar penetration in the market increases and coal-fired power stations close. We expect that market prices will increasingly be set by gas in the short term and pumped hydro and batteries in the medium term.
- We also expect contingency FCAS prices to finally start to fall with the high number of utility-scale batteries entering the market and the heady wholesale market prices of 2022 dissipating. Short of more protracted interconnection failures, we would expect 2023 FCAS prices to be substantially lower than in previous years. We also expect the share of the revenue for battery projects from FCAS markets to steadily fail from its current share of around 80% during non-outlier periods. This further underscores the opportunity for behind-the-meter batteries that can build more diverse revenue stacks that include the benefits of backup power and demand change management.
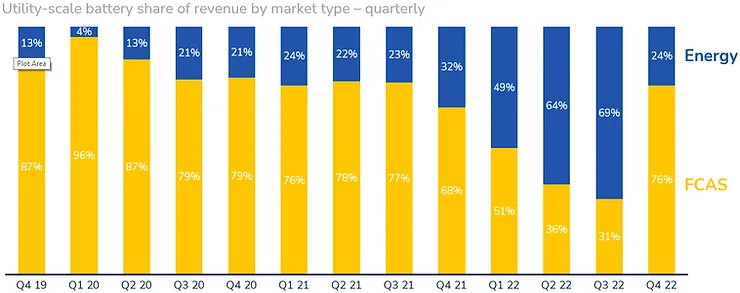
Figure 14: Utility-scale battery share of revenue by market type - quarterly (Source: AEMO Quarterly Energy Dynamics Q4 2022)
- The contingency Lower 60 second market will likely cut against the grain and increase in value for some time to come. The prices for the Lower 6 and 60-second markets exceeded the Raise markets late last year. We expect this will likely be an increasingly interesting opportunity for batteries.